Application Performance Monitoring tools are a necessity with modern websites where there distributed dependencies, multiple servers and front end frameworks doing a large amount of processing. There are a couple of big players in the market; New Relic and AppDynamics have been maturing into well rounded products for a few years, but Azure Application A is catching up quickly, and with more of a focus on .NET applications (although Java and Node.js are also supported), as well as integration with the greater Azure platform, it can provide a more rounded view of your application’s performance.
Application Map
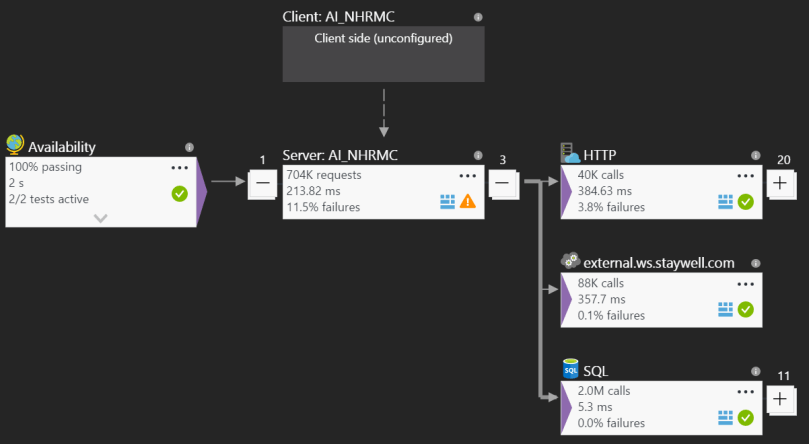
Knowing what makes up your application can be complex, and often times may request unexpected resources. The Application Map gives a graphical representation of requests coming into and out of your application, including outgoing HTTP requests, SQL requests, WCF service calls and more. You get a high level view of any specific points that may be encountering issues, as well as average response times and the throughput – each of which can be early indicators of future problems, or even just the realization of organic growth of the application.
Live Metrics Stream
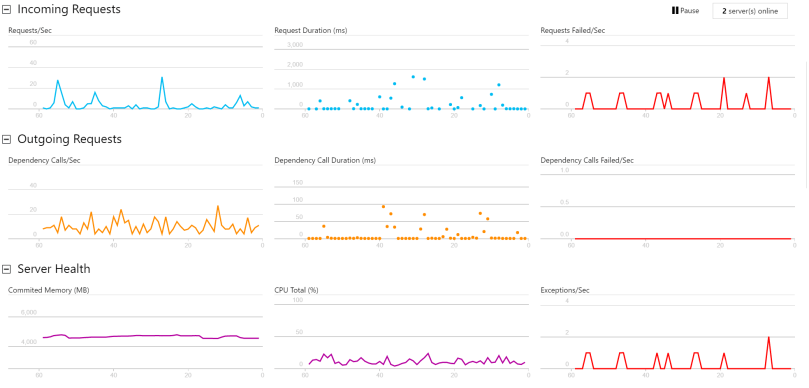
Once you have deployed a new version of your application, you want to know if performance has changed, as well as any sneaky bugs that may have been introduced that are only noticeable with real world traffic. The Live Metrics Stream gives you an up to the second view on the traffic going through your servers. Out of the box it will provide information on the number of requests being served per second, as well as their duration and failure rates. You can also see the traffic leaving your server to the dependencies notes above, and finally an aggregate view of the Memory, CPU and Exceptions being handled by your servers. All this information can provide vital diagnostics on whether to pull a new release or not, as well as whether further investigation is required.
Smart Detection
One of the best tools within Application Insights is Smart Detection. This is a completely passive service that requires no configuration, but will silently monitor your application data and proactively alert you via email if there is something unexpected happening. This includes a sudden spike in error messages, or a change in the pattern of client or server performance. These kinds of alerts are tremendously useful, as they mean you’re not relying on someone within your company, or worse, your client, telling you that something isn’t working correctly.
Log Analytics
The Application Insights team has provided a number of log utility extensions that integrate with Application Insights, to be able to get a centralized view of logs, which can be used for post-mortem analysis of a problem, or even for generating live dashboards. One of these extensions, which is hugely useful for Sitecore, is the log4net appender. It works as an additional appender for the one shipped with Sitecore, and allows you to send your log files to Application Insights, as well as logging to disk.
Other features
As with any good APM tool, it is also possible to dig into data for slow pages, common exceptions, even the browser performance, if you’ve enabled browser tracking via a javascript beacon.
