One of the key principles in managing your own applications or infrastructure is to be able to alert on important metrics. These metrics may be server-based, such as CPU usage or free disk space, or at an application level, such as slow response times, high throughput from a specific region etc.
Microsoft Azure’s monitoring and alerting methods allows us to query almost any metric that is being gathered, set thresholds and react to that threshold being breached. As of this post, Azure Monitoring allows us to send emails, send SMS messages, trigger webhooks, initiate an Azure LogicApp or even integrate with an ITSM tool.
In this post I’ll walk through the terminology used in Azure alerting, as well as setting up a simple email alert based on a resource metric.
Monitor – Somewhat confusingly, Azure has a resource called Monitor, which is the hub for all your monitoring needs. From here you can see open alerts, the metrics you can query on, as well as get access to Action Groups
Action Groups – These are the definitions of what you want to happen when an alert is triggered. It is here that you define who to email or text, which LogicApp to start etc. Action groups can be shared across multiple monitor checks
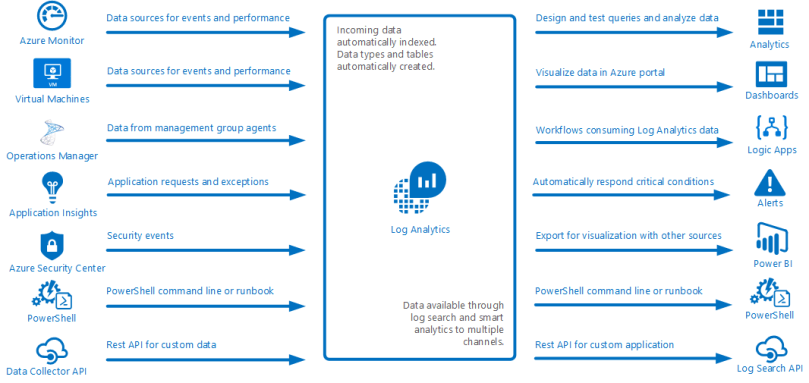
Log Analytics – Previously called OMS (and often still referred to as OMS within the Azure portal) Log Analytics is the centralized location for all log and diagnostic data coming from Azure and non-Azure resources. The following image, taken from Microsoft Documentation, illustrates this perfectly;
Creating an Azure Monitoring Alert
Create a Log Analytics resource
First you will need to create a Log Analytics resource, if you don’t already have one. To start with the Free tier will be sufficient, but as you add more inputs, you need to review the data usage to ensure you can capture everything. Typically I suggest creating a specific Resource Group for all Monitoring resources. Doing this keeps all logical items together, and it also means one can generally export the ARM template for this Resource Group and store it as a backup, or a template, for the future.
Send data to Log Analytics
Most resources on the Azure platform make it simple to ship diagnostic data to Log Analytics, although the terminology used between resources is sometimes a little different.
In this example, browse to a Virtual Machine, then browse to the Diagnostics settings option in the left panel of the blade. From here you can see an overview of all the types of data that can be shipped;
- Performance counters
- Log files
- Crash dumps
As well as optionally outputting data to Application Insights.
To begin with, browse to the Performance Counters tab and ensure that CPU is checked. You can enable others as well, but we’ll just be querying off the CPU data for now
From this point, browse back to your Log Analytics resource, find Virtual machines in the left panel of the blade, then find your VM. After clicking on it, a small diagnostic window will appear, showing you whether the resource is connected to this OMS/Log Analytics workspace or not. If it is not yet connected, click the Connect button, and within a few minutes the Log Analytics workspace will be receiving the counters selected above.
Creating the alert
Creating the first alert will consist of two pieces – defining the actual monitor check, as well as creating the Action Group that defines what to do when the alert is triggered.
From within your Log Analytics workspace, click Alerts in the left panel of the blade. This will show you all the alerts for this workspace – of which there will currently be none.
Click the New Alert Rule button at the top of the Alerts blade, and you will be taken to a wizard-like interface that will provide guidance in creating the monitor.
The first thing to do is select a target – depending on how you navigate to this screen, a resource may already be selected – click on the Select Target button, then find your Virtual Machine (you may need to change the Resource Type to Virtual Machines to find it).
After selecting your target, you can add criteria to the alert. In this instance, we are limited to the criteria that the Azure portal has defined for us (see an upcoming Part 2 where we can get more granular) . For now we will alert based on CPU usage, so select the Percentage CPU metric. This will present a graph of that metric for the last 6 hours (by default), as well as the logic options for the alert.

The Alert Logic section if fairly self explanatory, however the Evaluate based on is a little more nuanced.
The first dropdown will determine the amount of data to return from the query – in this case, it is saying ‘give me the last 5 minutes worth of data for CPU percentage utilization’. The second query will determine how often to run the logic. In the image above, the alert will trigger if, at any point over the last 5 minutes, the average CPU utilization has been above 10%.
When you are happy with your alert thresholds, you can click the Done button, and return to the main alert blade.
Next you can define details for the alert, such as Name, Description and Severity.
Finally you assign what to do when an alert triggers. This is managed using Action Groups, which can contain one or more of Email addresses, webhooks, ITSM links, LogicApps or automation runbooks. The configuration of each of these is fairly straightforward, and I’ll be covering LogicApps in a future blog post, so I won’t go into detail on how to configure them here.
Once the Action Group is defined and selected, click Create Alert Rule and your rule will generate in the background and become active immediately.