The time it takes to load a web page has been shown to have a dramatic impact on user experience, extending to conversion rates for sales as well as overall traffic engagement and retention. So whether you have an e-commerce site or a marketing/brochure-ware site, delivering a fast experience to your user is hugely important. Studies have shown that in the ‘information now’ age, attention spans are diminishing which is leading directly to the results of the studies above. According to a study by SOASTA, users expect pages to load in similar times across all their devices; 1.8 seconds on a desktop compared to 2.7 seconds on a mobile device – the latter being something quite difficult to achieve!
What does “page load time” mean?
One of the problems with a metric such as “page load time” is that it can mean different things to different people. For the average user it may mean “once the page has loaded and I can do something”, for a developer is may mean “once the first byte of data has reached the browser”. If you’re approaching the problem of slow page load times – or even just optimizing what you have – it is important to level set on what the true metric is. However, even taking the average user’s definition has some nuances – do they care if items are downloading in the background if the part of the page they want to interact with is usable? For example, a streaming video banner may continue to download in the background after the initial state of the page has loaded, but doesn’t have a negative impact to the user. If items outside the initial visible window are download after the visible portion is loaded, do they care?
Metrics to care about and how to track them
This is only my consideration at this moment, but I believe there are 3 important metrics to focus on (these are terms used by the webpagetest.org tool);
- Time to First Byte (TTFB) – This is the amount of time it takes for the request to leave the users browser, reach the web server and have HTML processed, and the first byte to be received back by the browser.
- Start Render – this is the time, including TTFB, that it takes the browser to start to apply visuals to the user’s browser
- First Interactive – this is the time it takes for the browser to process all required styles and scripts and for the user to interact with the page (I personally believe this is the “page load time” that the average user cares about)
- Page load – All assets have been downloaded from the server and the user can navigation around the page.
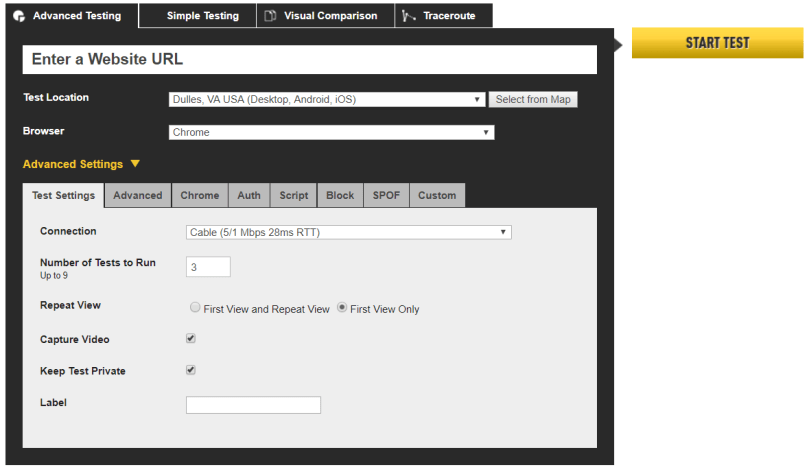
As alluded to above, one of the best tools around to monitor page load times is www.webpagetest.org. On the testing side, it allows you to simulate the browser, location and in many cases the device used for the test. This means you can check to see how your site fares on a desktop browser with a cable connection from Chrome, as well as a Galaxy S5 running Opera Mini on a slow 3G connection. There are a slew of other settings that can be applied, such as custom headers, basic HTTP authentication, or even pointing to external domains to fake a failure to see how your site reacts.
On the results side, there is everything from the Executive Dashboard style A-F rating for 6 categories, down to the exact waterfall chart that was the result of the request. 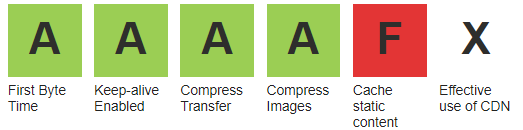
Using this data it is possible to identify which individual requests are slowing down your page – this could be an unoptimized image, too many assets being downloaded or even a third party site being unavailable and blocking your page.

