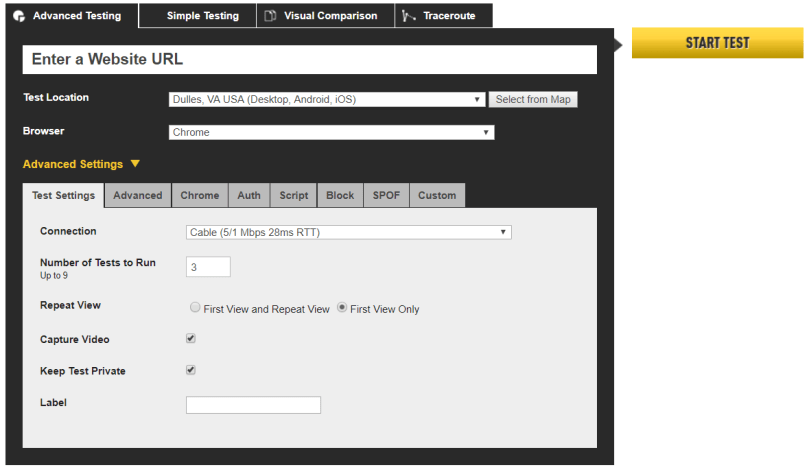
In Part 1 we covered the basics of what Page Load Time refers to, and one potential way of tracking it. In this post I’ll describe some potential solutions and some other considerations
How can I make my site perform better?
There are a huge number of potential problems that can impact page load speed, here is an in-exhaustive list along with some suggestions as to how they can be improved.
A llooonngggg TTFB
Every page on your site should be targeting 500ms for a TTFB. Anything more than this and its unlikely the browser will have time to render anything before the user becomes frustrated with the experience.
Although the TTFB includes things such as network latency and SSL negotiation (your site is running over HTTPS, right?), the most likely culprit is that the web server is taking its time to render the HTML to return to the user. Depending on the underlying application, there could be a multitude of reasons for this.
If you are using a CMS such as Sitecore, Drupal, WordPress, Umbraco etc, it’s less likely to be the actual CMS, but rather the custom code sitting on top of it. Each of these tools have profiling tools that can help to identify individual components that are causing the slow down. Once identified the code can be optimized by whatever means necessary (use an index rather than going to the database, improve the data architecture within the CMS to reduce lookups etc).
If your site is completely custom, using a tool such as Application insight (from Microsoft Azure) or New Relic’s APM tool can provide stunning insights into your application without additional instrumentation (you can extend what gets tracked with custom code).
Whichever implementation you have, after optimizing the code as far as you can (without getting into silly micro-optimization theater world) you should cache individual components or datasets where appropriate. There is little point in spending precious CPU cycles re-generating the same HTML time after time (I’m looking at you, Header and Footer)
One of my tracking scripts is blocking the page loading
This is a tough one to solve, but what I’ve seen happen time and time again is that marketing teams request a tracking script to be added to a page (or a site), get the data they need then move on. This is rarely a malicious act, but a side effect of not having good governance over tags being injected into pages. This is becoming more prevalent with tools such as Google Tag Manager, or Tealium that act as injectors for tags onto a page.
Often these tracking tags require being near the top of the page to track data accurately, and so when they do not load they block the rest of the page.
I’d recommend two solutions to this problem;
- Do an audit of active tags on your site and validate which ones are still required, and which ones can be removed. Removing old tags has a positive impact on the performance of the page anyway, as it reduces the requests needed as well as minimizes the amount of JavaScript to be run
- If possible, mark the tags with async or defer attributes to allow the browser to move passed the request and pull the asset down at a more appropriate time. This is not always going to be possible, so it is best to check with the tag vendor.
Images are taking up the bulk of the request
There will be a tension between performance minded folks (hello!) and UI/UX/Designers who want the best quality imagery possible. What can be an important first step is to run the page through Google’s Page Speed Insights tool, which will give hints on specific parts of the page to optimize, but most importantly will provide a download optimized images. These can be used as a case to show how images can be reduced in file quality without degrading the impact of the image to the user.
Another option, if your CMS or custom application supports it, is to provide the imagery in a next gen format such as JPEG XR or WebP. Contrary to the universal support of JPEG, PNG and GIF formats, different browsers support different next gen formats. Although each of these new formats are competing against each other, each of them provide benefits over the old school formats, so if you’re able to serve your Chrome users a WebP image, they’ll spend less time waiting for the image to load and have a better experience!
I have a lot of repeated requests on subsequent page loads
By default, every asset referenced from the page, including the page itself, will be downloaded from the server every time. This is generally an undesirable effect as the data for those assets is very often completely unchanged from one page load to the next. What we can do to mitigate this problem is instruct the browser to cache the results of those requests so that they’re not made again, and the data is taken from the users browser, not over the network.
This does come with some potential issues – how do you instruct the browser to get a new copy of the file, for example? When telling the browser to cache something, you also dictate how long to cache it for, and when that time has expired, the browser will request it from the server again. If that isn’t sufficient, the ‘key’ to an entry in the browsers cache is the URL, including the query string. If you need to force a new version to be downloaded right now, you can append or amend a query string parameter to effectively give the asset a new URL, which won’t exist in the browser’s cache, and it will be re-downloaded.
What else?
These are the common factors that will probably fix 90% of page load issues, however sometimes even that isn’t enough!
Edge Caching
If you have a high throughput site with some fairly static content (i.e. you’re not running A/B tests, or personalizing the content etc) you may want to look at some ‘edge caching’ tools such as Akamai, Cloudfare or Varnish (the latter being a roll-your-own product). These tools can cache whole pages, or parts of a page, and offload processing from your web server, meaning CPU cycles are spent on the important parts of the page, and lowers the overall TTFB.
Content Delivery Networks
If your site is used over a wide geographic area, a Content Delivery Network (CDN) can work to serve your content from a server nearer your user (similar in many ways to an Edge Caching service).
This also works for serving common libraries, such as jQuery or Bootstrap, to your user from a super-localized server. Given the shorter distances required for the data to travel, some assets on the page will be delivered faster, which will lead to faster load times. If you user has previously used that specific version of the library from another website, there is a good chance it will be cached locally to their machine, meaning there is no network time included at all.